- Home
- About Us
- The Team / Contact Us
- Books and Resources
- Privacy Policy
- Nonprofit Employer of Choice Award

Wouldn’t it be nice to find out exactly what donors really want? Imagine being able to peek into their minds and hear their every thought!
 If you’re thinking that this sounds like science fiction, I have some good news for you. We don’t need to wait for brain implants to become a reality, because we can use modern website tracking systems like Google Analytics to follow donors’ online behaviour.
One of the most important features in Google Analytics I use with many of my clients is called Audience Segments. It might sound a little scary, but it’s really easy to use and will open your eyes to how your site may or may not be meeting your donors’ needs.
What you'll need for today's tutorial:
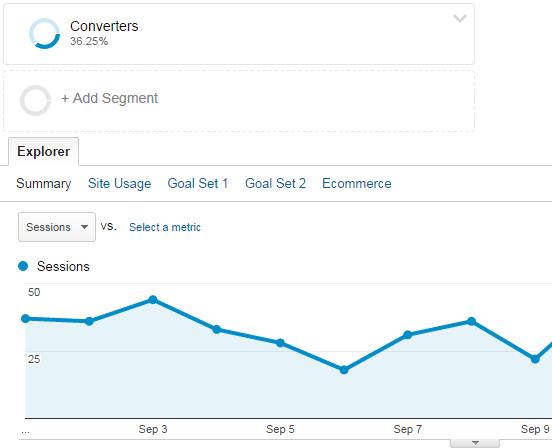
Step 1: Set up your audience. Visit any report on the side navigation of your Google Analytics account and click “Add Segment”:

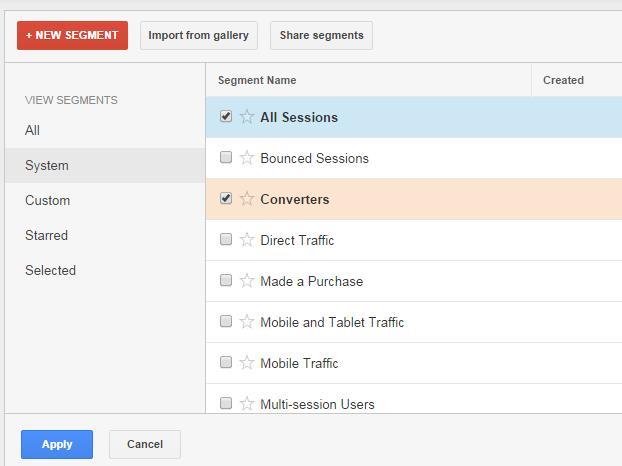
Step 2: Select Converters and then click on the Apply button:

Step 3: Now you can browse your reports as a “donor” (converter), and see your site performance from their perspective.
The beauty of Google Analytics lies in looking for patterns in the information. That’s what allows you to understand your audience.
For example, imagine finding out that 80 per cent of donors read a patient story first. Wouldn’t it make sense to make them more prominent on your website? Or suppose you found out that a page you thought was very important wasn’t having much impact after all. You can only find out things like this by setting up audience segments.
More segments
Why stop at browsing as “any donor”? When you drill down even further, you can learn even more.
You can download and view these segments in your Analytics profile. To do this, first make sure you are logged in to Google Analytics and then click the link.
Visitors from Canada
https://www.google.com/analytics/web/template?uid=MaNQDm_pSo2l4fiBP6-dgA
This segment shows only what visitors from Canada are doing on your website. Many of our charity clients only focus on Canadian customers.
Visitors from outside Canada
https://www.google.com/analytics/web/template?uid=PnC_upipSSuWZbu4tKB6OA
This allows you to see what visitors outside of Canada are doing on your website. If you target donors or have members outside of Canada, this will allow you to see if they have different interests.
The socializers
https://www.google.com/analytics/web/template?uid=PtMpspwuS6K72ySn9kDJ6Q
This segment allows us to see what people who find you through social media are doing on your website. Are they converting into donors? Is there certain areas of the website they visit more often?
Regional visitors (Western Canada)
https://www.google.com/analytics/web/template?uid=SF7EW6J8Rau2vGU3qB79PQ
Similar to the Canadian segment, these additional segments show what users in Manitoba, Saskatchewan, Alberta, British Columbia and Yukon are doing.
Regional visitors (Eastern Canada)
https://www.google.com/analytics/web/template?uid=SF7EW6J8Rau2vGU3qB79PQ
This further segmentation shows what users in Ontario, Quebec, Nova Scotia, New Brunswick, PEI, Newfoundland/Labrador and Nunavut are doing.
These filters are just the tip of the iceberg. As you experiment with the audience segment tool in Google Analytics, you will find information that will help you make your website more useful for donors and supporters. That can lead to more engagement, more sharing, and hopefully more donations to your cause.
A tireless explorer of new developments on the web, Todd Jamieson has been keeping pace with its constant changes since 1996. Through EnvisionUP.com, Todd and his firm have worked with over 100 non-profits and charities. He lives in Ottawa with his wife and two young boys. Follow him via twitter.